
Determination of Heavy Metals in PET Materials for Food Packaging by Atomic Absorption Spectroscopy
Introduction
Polyethylene terephthalate, commonly known as PET plastic, has the molecular formula (C₁₀H₈O₄)_n and is produced via the polycondensation reaction of alcohol esters. Its physical properties are similar to other plastic materials, and it has been extensively utilised across various industries. Common applications include food packaging films, containers, sheets, and disposable tableware. During PET plastic production, heavy metal elements readily accumulate within the final product, potentially contaminating foodstuffs and, in severe cases, adversely affecting consumer health. Currently, domestic testing for heavy metals in plastic materials predominantly focuses on migration levels rather than total content. Primary analytical methods include atomic absorption spectroscopy, atomic fluorescence spectroscopy, and inductively coupled plasma-mass spectrometry. This study employed super-microwave digestion for the pretreatment of PET outer packaging bottles from six brands of carbonated beverages. Atomic absorption spectroscopy was then used to determine the concentrations of six heavy metals: Cu, Pb, Cd, Zn, Fe, and Mn. The influence of experimental methods and instrument conditions on the test results was investigated, providing a reference for the practical application of atomic absorption spectroscopy in measuring these six heavy metals in PET packaging materials.
Translated with DeepL.com (free version)
1 Experimental Section
1.1 Apparatus and Reagents
AA-1800C Atomic Absorption Spectrophotometer; Microwave Digester; Electronic Analytical Balance.
Fe, Mn, Cu, Zn, Pb, Cd standard solutions and quality control samples were selected from products of the Standard Sample Research Institute of the Ministry of Environmental Protection. All standard solutions had a concentration of 100 mg·L⁻¹. Quality control sample concentrations should be suitable for the standard curve of this method, avoiding dilution where possible. HNO₃ and H₂O₂, analytical grade, Tianjin Kemiou Co., Ltd.; Laboratory water was deionised water produced in-house using a Milli-Q ultra-pure water system (Milli-Q, USA).
1.2 Standard Solutions
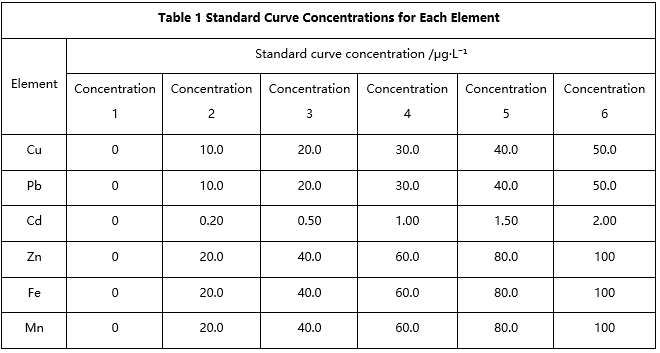
1.2.1 Standard Curve Concentrations
Dilute each of the six standard solutions stepwise to the applicable concentrations. Prepare the working solutions using 5% dilute HNO₃, label them appropriately, and set aside. To avoid interference, it is not advisable to prepare a mixed standard working solution. See Table 1 for details.
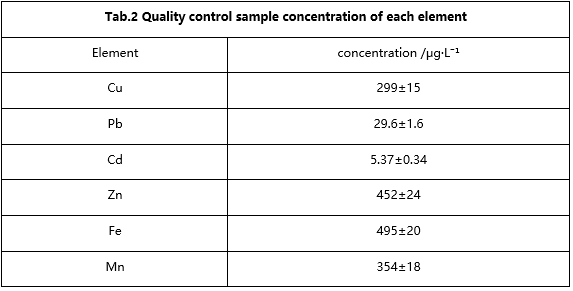
1.2.2 Quality Control Sample Concentrations Certified reference materials shall be prepared 1.2.2
1.2.3 Quality Control Sample Concentrations Certified reference materials shall be prepared according to their certificates of analysis. Diluted within the standard curve range, they shall be labelled and stored for future use. Concentrations are detailed in Table 2.
1.3 Sample Preparation
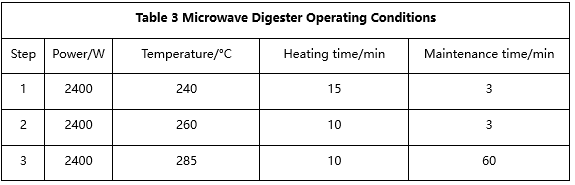
Select representative specimens. Clean the outer surfaces thoroughly, then cut into fragments smaller than 5mm × 5mm. Accurately weigh 0. 2000–0.5000 g, and place it in a clean, dry polytetrafluoroethylene digestion vessel. Label the vessel, add 1 mL of pure water to moisten the sample, then sequentially add 5 mL of HNO₃ and 3 mL of H₂O₂. Seal the vessel and perform microwave digestion according to the conditions specified in Table 3. Upon completion of digestion, allow the digestion vessel to cool completely before carefully opening the lid. Rinse the vessel's inner walls and lid with a small volume of pure water, then dilute to a final volume of 25 mL. Mix thoroughly in a volumetric flask and set aside for analysis. Concurrently prepare a 10% blank sample. Depending on the heavy metal content in the sample, dilute the final volume to ensure the sample concentration falls within the range of the standard calibration curve.
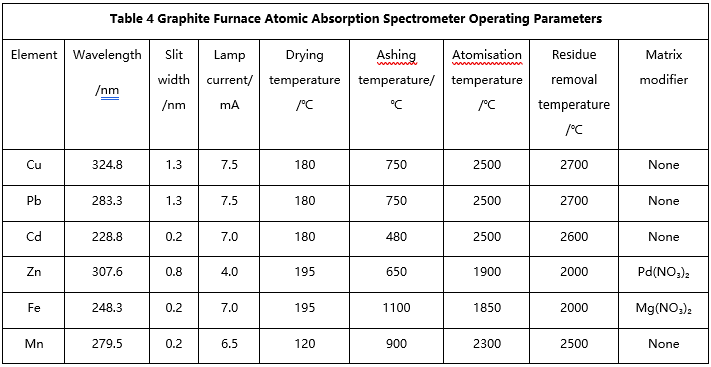
1.4 Instrument Conditions
Optimise instrument operating conditions to ensure sensitivity and other parameters for the target elements meet analytical requirements. Determination conditions for each element are detailed in Table 4